Feature info and howto’s
Request
The SaaS ETL platform had a specific feature that was crucial for many customers. The platform's UI was rather techno-dependent, so a detailed video tutorial on using this feature was requested.
Since the feature was used by users of different access levels, it needed both shorter and more in-depth descriptions.
Also, a purely technical side of the platform - JSON-code - took a significant part in this feature and was often needed alone just to tweak this or that, so there had to be a specific fragment of tutorial that only elaborated on this particular part and its UI.
Solution
"Rates" page.
For this set of tutorial I developed a proper scenario and data set to demonstrate all the sides of this feature. In cooperation with the Support team, the key points of its daily usage were highlighted. For the shorter tutorial I created a simple video whereas the more in-depth one became a series of two videos plus the additional third one - with the purely technical part of the feature.
Platform and tools used
Docs site run on a static site generator; Git, VSCode, Markdown, iMovie, Movavi Video Editor.
Rates are the factors that are used in calculations, eg: Spend = Installs * 3, where 3 - the rate.
As a rule, rates differ by countries, OSs, time frames, etc. For all of that we have tools to make the Spend values always relevant.
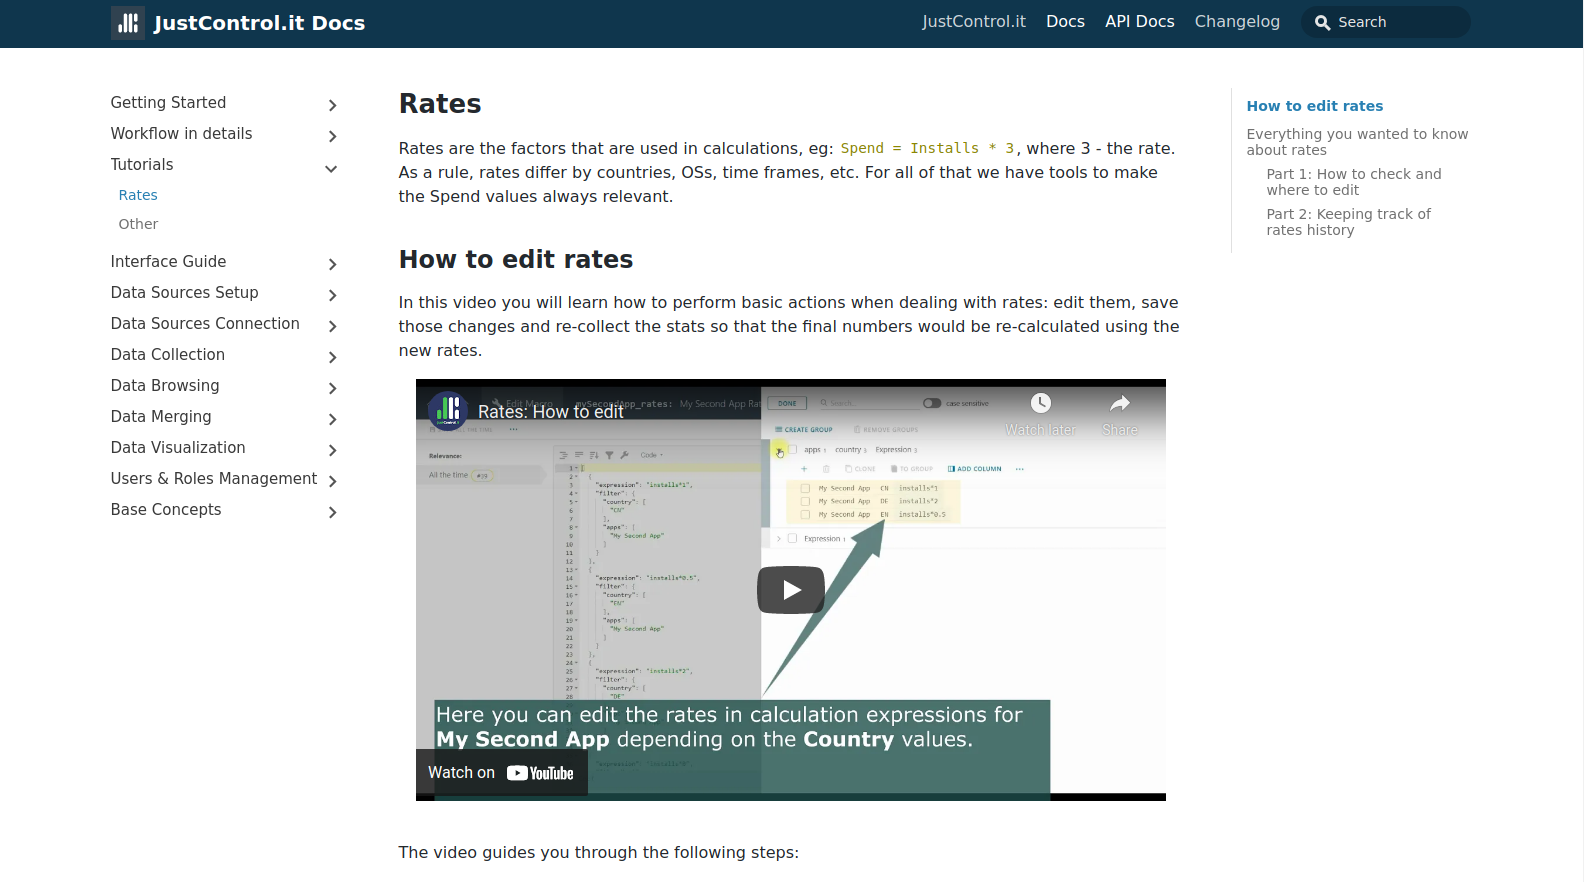
How to edit rates
In this video you will learn how to perform basic actions when dealing with rates: edit them, save those changes and re-collect the stats so that the final numbers would be re-calculated using the new rates.
The video guides you through the following steps:
- Viewing the original calculation results in a dashboard Datagrid widget
- Editing the rates in a macro with the means of the Merge Module Arithmetics component Visual editor
- Re-calculating the numbers by re-collecting the Integration stats
- Viewing the new rates calculation results
Everything you wanted to know about rates
Technically speaking, rates calculations involve more actions to be set up and managed. Some of JustControl.it users might require deeper knowledge of those things and the two in-depth videos below will shed light on it.
Part 1: How to check and where to edit
Detailed video on how to edit rates using Arithmetics Merge Module component and check the result.
In the video you have the basics of how different rates are applied to different campaigns explained.
- The existing metric and newly created breakdowns (using the Value Mapper Merge Module component) data columns that take part in Spend values calculation are shown on the Integration’s Browse data page.
- The Arithmetics Merge Module component that performs the calculations is shown in the Integration’s data transformation flow diagram
- Detailed explanation on how to read the Arithmetics component’s JSON-code are given (also available as a separate How to read the Arithmetics code video)
- Another way of editing the rates - via the Arithmetics Visual editor is shown both for an Integration and a macro config
- With the Arithmetics Visual editor and Browse data + Tasks pages side by side, the rates changes and re-calculation results checking are demonstrated
“How to read the Arithmetics code” fragment
Learn which fields help calculating and storing the rates.
This is a fragment of the Part 1: How to check and where to edit video with a detailed explanation on how to read the Arithmetics Merge Module component JSON-code.
Watching it you’ll find out what and where to edit to change the rate or to make them work for different campaigns, etc.
Part 2: Keeping track of rates history
See how to use config relevances to make sure your rates are relevant for all the time frames.
Note: depending on where your rates are kept, can either be the Integration (shown in the video) or macro config relevances.
In this video you will see how to set different rates to be used in the same case (country, OS, etc) but for different dates - create multiple macro config’s date range relevances.
It is shown using this flow:
- On the Config page, edit a date range relevance of the two configs making each of them relevant for its own date range. They will be ordered chronologically on the list
- With the Arithmetics Visual editor, change the rates in one of the config relevances
- On the Tasks page, re-collect the stats for the new config relevances and rates to be applied
- On the Browse data, check the calculations result for different dates